

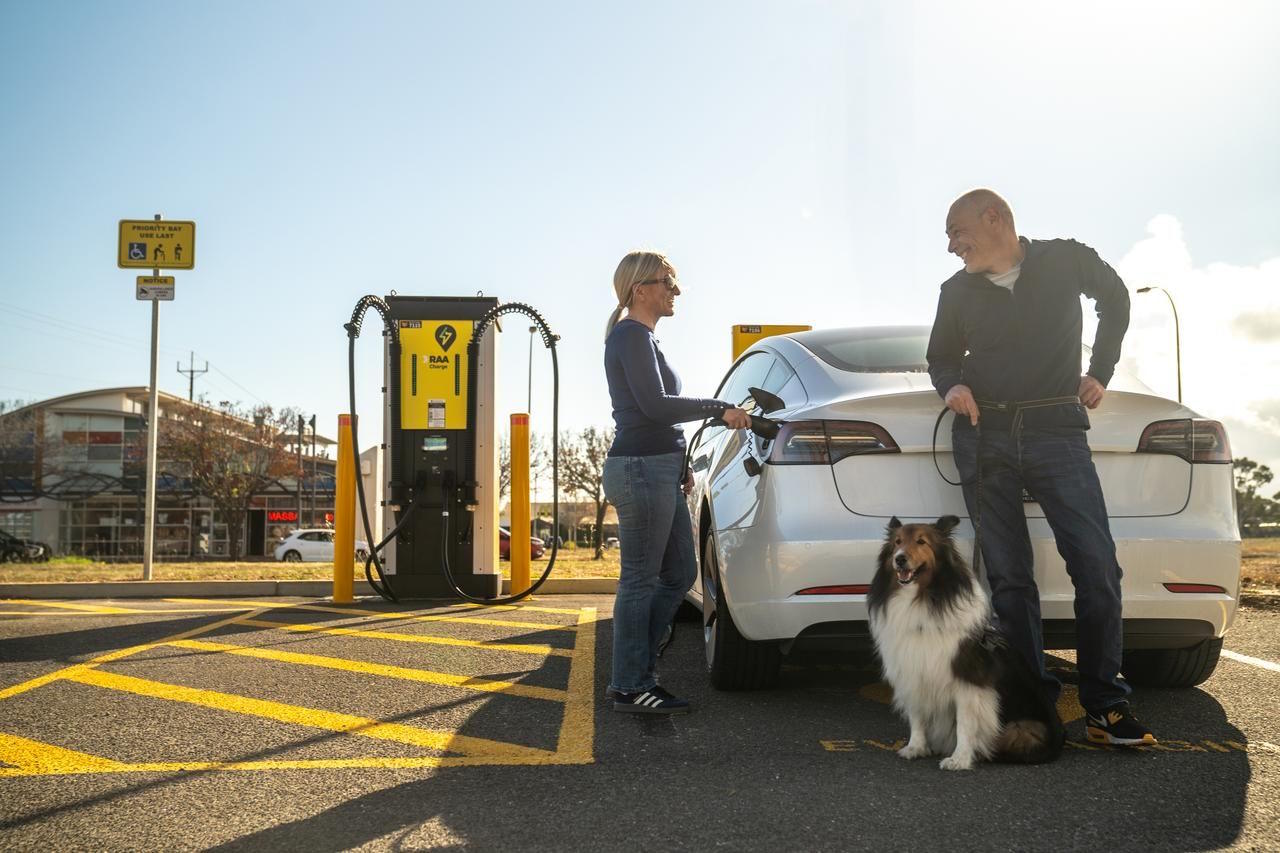
It was World EV Day on Tuesday, September 9, and so no better time to celebrate the progress of the Australian public charging sector in enabling and supporting our growing uptake of electric vehicles to reduce national costs and emissions!
As a BEV and PHEV owner/operator for more than a decade, as well as Australian public charging industry practitioner throughout that time, I have a better appreciation than most for how far we’ve come as a market!
My own tracking agrees with other charging industry sources and commentators that as of mid 2025 Australia now has approximately 1,300 public DC fast charging sites relative to our ~370,000 total EVs, and you can also readily deduce from a quick tour on Plugshare that we have many thousands more slower public AC charging sites for our growing EV end user base as well.
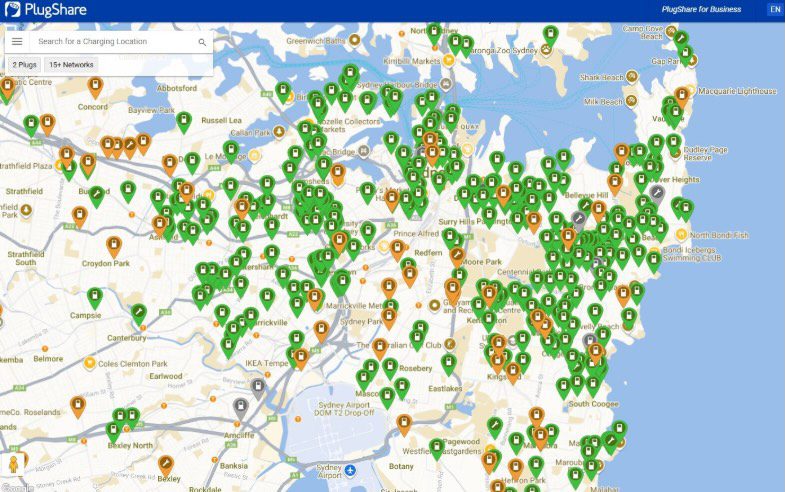
Public charging infrastructure (DC in orange and AC in green) throughout Sydney’s dense Inner West, Inner South and Eastern Suburbs at the time of writing (source: Plugshare)
However, our sector has unfortunately been plagued by poor visibility and data quality, and with many erroneous datapoints circulating in our public charging policy and regulatory debates of late (so I have debunked most of these at the very bottom of this article).
This post is as factual as I can make it based on the available empirical data in order to provide balance and reassurance around the present status and forward trajectory for Australian public charging.
Measuring the Metrics
A favoured metric for quantifying public charging is the “IEA method” that calculates the ratio of the total number of EVs to the total number of public charging points in a country. Per this method, based on our at least ~10,000 public charging points as of mid 2025, the present Australian ratio is <40:1 (lower is better).
Our ratio is further lower in leading jurisdictions such as New South Wales who have co-invested heavily into public charging of all types in a diverse and competitive marketplace (such as metro and regional fast charging, plus widespread destination charging, plus inner urban kerbside charging).
However the IEA method is complex and problematic since it incorporates both BEVs and PHEVs, as well as both public DC and AC charging, and so it can be hard to decipher its practical meaning.
I prefer a different, simpler metric that compares the number of fast charging points to the number of battery electric vehicles, as I find this to be more intuitive as well as more insightful.
Firstly, we know that BEVs (unlike PHEVs) particularly benefit from public fast charging for range extension and/or convenience top-ups, especially in broader geographies like Australia with its relatively low population density and high level of detached housing (for private charging otherwise).
Secondly, the international evidence shows a strong and direct correlation between fast charging provision and BEV take-up, whereas any correlations with AC charging or PHEVs are much weaker.
Thirdly, this metric eliminates the extra complications inherent in the IEA method from the inclusions of AC charging or PHEVs, and thus helps for making intuitive comparisons. Finally, this metric (unlike the IEA ratio) results in a higher number being better and so provides a proportional score to evaluate national charging capacity.

Public DC fast charging infrastructure throughout regional New South Wales at the time of writing (source: Plugshare)
Australian Public DC Fast Charging
The chart below shows a selection of global regions and countries compared via this metric. The quantity shown in the blue bar is the number of fast charging points per 1,000 BEVs, and the blue bars have been sorted in ascending order of this metric.
The raw data for all regions has been sourced from the IEA Global EV Outlook 2025, except for Australia where the IEA data is known to be incorrect (understated), and thus local industry empirical data for mid 2025 has been used instead.
The number of BEVs is sourced from the public-domain Australian Automobile Association EV Index and the number of public DC and AC charging points are approximately ~4,000 and ~6,000 respectively from proprietary industry sources.
We can see that Australia’s relative DC charging capacity is clearly in line with its natural geographic peers (i.e. we are just ahead of the USA and Canada, and not far behind New Zealand or Norway).
We can also see toward the bottom that the trend into Europe, and then even more so into Asia, is for a higher public fast charging density, no doubt in large part due to their much higher population densities and much lower levels of detached housing.
China has been particularly excluded from the chart as an outlier given its own BEV population exceeds that of all the other regions combined, and also given its fast charging rollout is coordinated and enlarged by central government policies.

Relative public charging infrastructure densities around the world – with public DC fast charging shown in blue, and equivalent public slow AC charging in orange (source: Verdant Vision analysis of IEA data, adjusted for known Australian errors)
Australian Public AC Slow Charging
We can also consider the relative density of public AC charging (the orange bars) through a derived equivalence factor. The international literature notes that a public DC charger is worth many times that of a public AC charger, and from the World ex China dataset included here we can observe that the implied equivalence ratio is approximately 4 AC chargers per 1 DC charger.
This is not meant as a prescriptive rule of thumb to size networks in all regions, as the balance clearly varies between geographies, but through this common factor we may convert AC chargers into DC-equivalents for the sake of regional comparisons and also for the sake of comparing the influences of public DC versus public AC network capacities in the varying regions.
We can see that most countries have a material amount of public AC charging relative to their public DC charging, and that Australia is largely in line with its geographic peers. We again see a trend into Europe and especially into Asia for a larger amount of public AC charging too, but we also see some obvious outliers in the Netherlands and South Korea.
Both of these countries are small in size similar to Tasmania, yet both have high national population densities exceeding that of the Sydney Greater Capital City Area, so we can quickly appreciate why they should not be considered as benchmarks for Australia’s geography.
Conversely, we can see that Australia has slightly less equivalent public AC charging relative to some of its peers, and New Zealand is a particularly relevant example of a market that self-admittedly has failed to invest in enough public AC charging and is now quickly working to catch up.
Australia’s cities could consider slightly boosting their public AC charging capacity in line with promoting a more cosmopolitan inner urban experience similar to the United Kingdom, but given Australian geographic attributes this analysis suggests only a subtle increase would be warranted.

Public AC slow charging infrastructure throughout regional New South Wales at the time of writing (source: Plugshare)
Also note that the above comparison metric does not distinguish between different locations or end use cases for public charging. It does not presume whether DC or AC charging is located in the inner cities or outer regions, and also does not presume how charging equipment is hosted nor installed.
The competitive marketplace of charging point owners/operators solves for this, assisted by Government collaboration in network planning and co-funding.
Conclusions about Australian Public Charging
We can conclude that, at present, our national public charging segment is in due proportion to our BEV uptake and our geographic attributes, and generally in line with our geographic peers.
Our public charging is not lagging in any obvious way, and we gain nothing from chasing our tails relative to invalid benchmarks (such as China or the Netherlands or South Korea as discussed here.)
Given our national geography and prevailing built environment, our best benchmarks can be found in Scandinavia and North America, though e.g. the UK can help to guide our big cities.
There is no apparent evidence of national public charging market failure nor of any need for broadscale national interventions such as a national energy market rule changes to enable more public charging.
However, we can expect that the continuing growth of our EV market will depend on a broadening EV-buying demographic who will increasingly reside in the inner cities or regions.
So the prudent growth of our public charging sector must go beyond the densification of core public charging for core EV user demographics, and Australia’s remarkably high urbanisation coupled with remarkably low overall population density may lead to some internationally-unique challenges in this regard.
But even at the extremes, there are still a diversity of charging solutions available to deploy.
We don’t need to jump to presuming solely kerbside charging in the inner cities when workplace charging is also such a legitimate option, and similarly we don’t need to jump solely to standalone power systems in the remote regions when hybrid mini grids are so common in settlements at regular spacings along such routes.
What Australia presently lacks is a coherent national charging strategy with evidence-based targets and supporting methods to keep growing our public charging in the right proportions and in the right places as we head towards >1 million total EVs by 2030.
The good news is that our public charging is in much better shape than some would have us believe, and that we have a solid foundation to keep growing from.
And full credit where it’s due… this success not only arises from our charge point owners/operators (CPOs) who develop and operate the full diversity of sites to serve the full diversity of public charging end users, but also from our distribution network service providers (DNSPs) who own/operate the reliable power supplies to charging sites, as well as our local government areas (LGAs) and other commercial site hosts who own/operate the parking facilities and other desirable amenities that end users get to enjoy while they recharge.
Erroneous datapoints circulating in the Australian public charging marketplace debate
International Energy Agency datapoints
- Previous Australian IEA ratios in the Global EV Outlook database such as 68:1 (for 2023) or 76:1 (for 2024): In both cases these errors were caused by accidental underreporting of Australian public charging stock (both DC and AC), causing the IEA ratio to be artificially calculated as too high (unfavourable). In both cases this was found to have arisen from confusion in terminologies such as counts of public sites or chargers rather than plugs (or stations or units rather than points per the alternate IEA jargon).
- Current Australian IEA ratio in the Global EV Outlook of 45:1 (updated for 2024): This is still accidentally underreporting with the public AC charging stock understood to be less than half of the actual real world quantity, even though the DC stock has now been corrected for 2024 (only). The calculation is still too high (unfavourable) and should be <40:1.
- All the above erroneous IEA datapoints have appeared frequently in regulatory submissions as well as public commentary from institutions such as Energy Networks Australia and their selected DNSP members such as Ausgrid. These same errors have then been unfortunately promulgated by relevant regulatory agencies such as the Australian Energy Regulator and the Australian Energy Market Commission.
Australian stakeholder datapoints
- Energy Consumers Australia cited a derived IEA-style ratio of 37:1 in their recent public charging study delivered by HoustonKemp. The inputs to this calculation were an EV population of 300,000 and a public charging stock of 8,100 stations, both as cited by the Electric Vehicle Council in early 2025. Unfortunately the 8,100 stations was incorrectly used in lieu of the larger number of plugs/points for use in an IEA-style metric. So while this calculated ratio was coincidentally very close to the present market value, it was not calculated in the same way nor using equivalent input data as the IEA method. Also it’s worth noting that Energy Consumers Australia made many distinctions in their stated preferences for more public AC charging vs. less public DC charging, but did not consider the relative prevalence of either type of charging in their contributions to the total metric.
It is unfortunate that our national public charging sector debate has been so plagued by such poor visibility and data quality leading to promulgation of these errors.
However, given the contentious regulatory circumstances surrounding a debate of proposed changes to DNSP ring-fencing rules for public charging, and given that these erroneous datapoints have now been repeatedly debunked by the charging industry itself, any submissions from stakeholders making use of these errors in their rationale should be disqualified and discarded from the debate until more accurate open-source data becomes available to properly recalibrate discussions and decisions.
We must avoid erroneous policy making as it can only possibly lead to the long term detriment of our public charging market design and national electrification goals and EV end user experiences and satisfaction.
Andrew Simpson is managing director of Verdant Vision. First published on LinkedIn, reproduced with permission of the author.