Some people would have you believe that running an EV is both worse for the environment and costs more because EV owners need electrons to charge an EV rather than molecules to refill a petrol or diesel vehicle. Whilst the former point has been debunked many times (as examples, see articles here and here), it is the latter point that I will address here.
EV owners know that running a battery electric vehicle (BEV) is significantly cheaper than running an internal combustion engine (ICE) one, but putting a single number on the savings offered by a BEV compared to its ICE equivalent is a little trickier.
The reason? It depends on your choice of electrical supply as well as when it is charged.
Below is a table summarising the cost associated with each of five charging sources, plus a costing for what I defined as a possible ‘average’ mix of these. For those who are happy with that, you may stop reading there!
However, for those (like me) who want to know HOW the figures were come up with, following the table are the details of the rationale, assumptions, calculations and data sources.

Rationale, assumptions, calculations and data sources
Where possible I chose national data. However, when it comes to electricity tariffs – these are highly variable and tariff structures are (sadly) more many and varied than phone plans … as well as (mostly) state and retailer specific.
For electricity beyond an ‘average’ single-rate tariff, I picked a middle of the road state for pricing (Victoria, where I live) and referenced either the Victorian default offer, or chose a Victorian electricity plan where the default offer didn’t cover the option (like the EV super off-peak price).
My defined five main sources of electricity for an EV are as follows:
- Grid power: single rate tariff.
- Grid supply: (a) off-peak tariff and (b) EV super off-peak tariff
- Own solar: foregone feed-in tariff
- Public AC charging only
- Public DC fast-charging only
The calculations are by the way based on travelling 10,000 km a year as it makes it an easy number to work with to find your personal costs. (For instance: if you do 5,000 km a year, halve the number. If you do 20,000 km, double the savings. If you do 15,000 km, add half the amount to the 10,000 km figure).
To calculate the charging cost for each charging source, I assumed the EV owner used ONLY that source for the 10,000 km distance.
The final ‘typical mix’ energy cost number was then calculated using an approximation based on studies into how EV owners charge their cars.
For the purposes of making as direct a comparison as possible, the 2024 Hyundai Kona was chosen as it is a small SUV offered in both full electric and 2 litre petrol versions.
Assumptions
- Vehicle comparison: 2024 Hyundai Kona electric versus Hyundai Kona petrola
- Energy/fuel consumptionb: BEV: 13.1 kWh/100km (Australian Design Rule 81/02 test cycle); ICE: 6.6 litres/100km (Australian Design Rule 81/02 test cycle)
- Distance chosen for calculations: 10,000 km a year.
- Price per litre: $1.82 per litre. (Average Australian petrol price for 91 RON, Jan-Nov 2024c)
Calculations
Petrol Kona at 6.6L/100km
- 10,000 km a year at $1.82/litre = $1201
Electric Kona at 13.1 kWh/100km:
Scenario 1
-
- Grid power, single rate of 30.9c/kWhd = $405
Scenario 2
-
- Grid power, typical two-rate off-peak tariff of 19.9c/kWhe = $261
- grid power, multi-rate tarifff, super off-peak rate of 4.99c/kWh = $65.37
Scenario 3
Own solar, smart EV charger set to Solar Onlyg:
-
- At forgone solar feed-in tariff of 3.3c/kWh = $43.23
Scenario 4
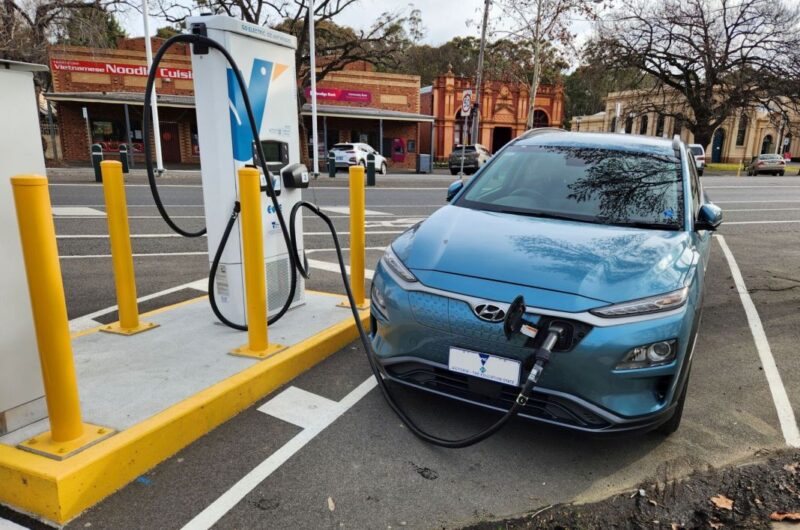
Public network AC charging for 100% of all chargingh
-
- At 45c/kWh: (note, many public AC chargers are still free) = $590
Scenario 5
Public network DC charging for 100% of all chargingi:
-
- At 65c/kWh: $851
Now to finding an ‘average’ saving for the ‘typical’ EV driver. Studies have shown 70% to 90% of all charging is done at home, 5% or less done by DC and the remainder done at work and/or public AC destination charging stations. For the purposes of finding the average fuel cost saving offered by a BEV, the following was assumed about to create a ‘typical’ charging profile for an EV driver:
- 80% home charging at an off-peak rate of 19.9c/kWh
- 15% destination charging (half free, half at 45c/kWh)
- 5% DC charging at 65c/kWh
For 10,000km this works out to:
- Home charging: $208.8
- Destination charging: $44.25
- DC charging: $42.55
- Total: $295.60
Average kWh price paid for that 10,000km: $294/1310kWh = 22.52c/kWh
Data:

Bryce Gaton is an expert on electric vehicles and contributor for The Driven and Renew Economy. He has been working in the EV sector since 2008 and is currently working as EV electrical safety trainer/supervisor for the University of Melbourne. He also provides support for the EV Transition to business, government and the public through his EV Transition consultancy EVchoice.


