
Chris Johnson just wrote a great piece in The Driven on long range trips by EV in Australia. Another good source is Tesla Tom’s videos of his Ludicrous Feed road trips where he checks out the performance of a variety of EVs
Chris’s article does a brilliant job of highlighting reasons why highway range can vary so much from day to day and from EV to EV.
He says: “The excellent EV Database gives a predicted maximum range for these vehicles [standard range EVs] travelling at 110kph in ideal conditions without use of air conditioning of between 295km (BYD Atto 3) and 330km (MG4 LR), with Tesla Model 3 an outlier at 385km.”
He then goes on to say, “unpredicted changes in wind direction and speed nearly caught us out twice . . .” and “hilly terrain also kills consumption.”
One constant in all the reviews I read is that Tesla’s Model 3 tops the scoreboard for range and efficiency. Now why would that be? And how much of an effect do speed, hills and headwinds really have on range under Australian highway conditions?
I decided to go back to basic physics and build a predictive model of EV efficiency. Please just remember that in the EV context the word Efficiency in watt hours consumed per kilometre (Wh/km) means something like fuel economy in L/100km for ICE vehicles. Engineers use “efficiency” in much more technical ways.”
The maths details are at the end. I’ll start with the summary:
EV Efficiency (in the familiar Wh/km format) = Power in Watts (W) divided by Speed in km/h. Simples!
The Power that interests us here is the power the battery must put out to run all the systems in the car.
Battery output Power in W = Force (in Newton) * Speed (in m/s) / (1 – Losses).
What is meant by Losses? Losses cover everything that burns battery power additional to moving the car forward. Losses include motor, powertrain and inverter inefficiencies which show up as waste heat, plus power for air conditioning, seat heating, lighting, wipers, entertainment, battery conditioning, etc, etc.
I’ve assumed that typical Losses are 8% which is pretty arbitrary. If you don’t agree with 8% feel free to assume something a bit smaller or bigger. You may even have some insider knowledge that tells you that some EVs have smaller Losses than others 😊. And some drivers run the air conditioning harder than others, especially on 40°C days.
Now let’s talk about the main game – Power that moves the car forward. There are three forces at play on a moving car:
Force to climb hills, i.e. fighting gravity – called Fg
Force to keep the wheels turning against “rolling resistance” – called Fr
Force to push through the air fighting aerodynamic drag – called Fa
These three forces add together so battery output Power = (Fg + Fr +Fa) * Speed / (1 – Losses)
Fg and Fr both vary with vehicle mass. Let’s keep it simple and assume a typical medium EV with loaded mass of 2 tonnes – 2,000 kg.
Fg = zero if the road is flat. Later we will look at how large Fg gets on steep hills.
Fr is pretty stable. It increases only slowly with speed so it is generally predictable and boring unless you drive onto rough surfaces like gravel or, heaven help, soft sand. Here we will assume smooth highway surfaces.
Fa is the interesting one that explains a LOT. It is interesting because so many factors affect aerodynamic drag. Your right foot is a biggie. So is the shape and size of your EV. And headwinds.
Before we look at Fa more closely, let’s check out some diagrams that may help make these forces more real. In everything that follows remember that lowest is best for Efficiency in the way we are discussing it here.

Look how steeply the Power required increases with Speed. Cruising at 110 km/h needs twice the power of 80 km/h.
Happily, as speed goes up Efficiency worsens more slowly than Power rises. This is because you cover more km when you are driving faster.
Now let’s look at the components of Efficiency in Wh/km for a mid size EV (think Polestar 2, MG4, Kia EV6, etc):
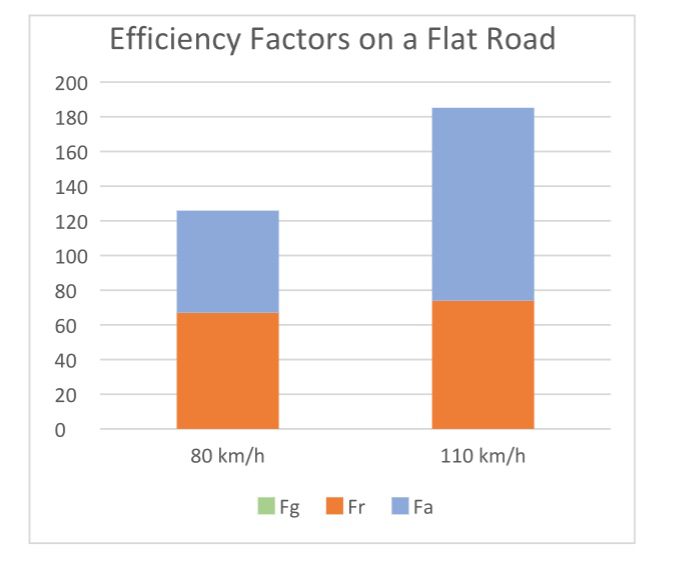
At 80km/h overcoming Rolling Resistance (Fr) takes about half the car’s power; the other half goes on Aerodynamic Drag (Fa).
See how Rolling Resistance increases only slightly with speed, but whoa! – the jump in Aerodynamic Drag from 80 to 110 km/h. That’s why Chris Johnson could get more range by slowing down when his battery was running low.
Now let’s add a 30 km/h headwind. Again, Efficiency is in Wh/km.

Look at the differences in comparison with the previous chart! A breezy 30 km/h headwind knocks Efficiency and range very badly – Wh/km consumption jumps up by a huge 37%.
To maintain range you need to back off your cruising speed by almost as much as the wind is blowing in your face. Certainly think about taking 10 or 20 km/h off your cruise setting if you’re heading into strong winds and are concerned about range to reach the next charger.
Now what about hills? Many people have commented that leaving Sydney invariably means climbing hills. For instance Goulburn is 190km from Sydney and 640m higher up – an average grade of 0.35% (640 over 190,000).
Katoomba is worse – only 100km away and 1,017m higher. Most of the climb to Katoomba is in the last 46km from Emu Plains – an average grade of 2.2%. Mostly you won’t even notice a grade of 5% on a highway, unless trucks slow down too much and get in your way. Grades over 8% become more noticeably steep.
Let’s see what effect grades have, ignoring the fact that the speed limits to Katoomba are way below 110 km/h. And assuming no headwinds. Efficiency is in Wh/km.

Well there you have it. Maintaining 110 km/h up a 5% grade for a minute or three may be great fun but it sure as hell destroys your range if you keep it up for long. Even a 1% grade which you will barely notice knocks efficiency.
Just 1% grade increases Wh/km consumption by 32%, and storming up a 5% grade increases consumption by 150% to nearly 500 Wh/km! Now think about climbing hills into a headwind.
And there, my friends, is the explanation for a lot of the variability we see in efficiency numbers from different routes and from overseas reporters. Even big flat Australia has some roller coaster highways and unhelpful weather conditions, so you can’t always plan for that ideal range number.
Now I want to talk about the Tesla Model 3 and its “outlier” range performance. To do so we need to dig into the drivers of Fa or aerodynamic drag force.
Fa = 0.5 * CdA * ρ * (v + w)2
Ouch, somebody said “Too much maths!” Stay with me. Fa has three drivers – CdA which is very interesting, air density ρ which isn’t because it changes only slowly with altitude above sea level, and (car speed v plus wind speed w) squared, which we have already discussed.
CdA is the product of Drag Coefficient Cd and Frontal Area Af in square metres. Most car manufacturers publish Cd data because it’s supposed to be a sexy number and wind tunnel engineers are very proud of how slippery their (car) shapes are – any Cd below 0.30 is regarded as pretty good.
Most EVs score a Cd of around 0.28 which is more than ok. But look at who blows away most others (sorry bad pun) with Cds of 0.23 – Tesla’s Model 3 and Model Y, in fact all Tesla cars.
Then we come to Af or frontal area – this is approximated by 85% of Height times Width, except we know that the Tesla Model 3 has a frontal area of 2.22 m2 which is a little less than 85%. Based on published data here is a table of CdA for selected EVs.
| @ 85% | |||||
| EV | Cd | Width | Height | Af m2 | CdA |
| Tesla Model 3 | 0.23 | 1849 | 1443 | 2.22 | 0.51 |
| Tesla Model Y | 0.23 | 1921 | 1624 | 2.65 | 0.61 |
| MG4 | 0.27 | 1836 | 1536 | 2.40 | 0.65 |
| Polestar 2 | 0.28 | 1859 | 1479 | 2.34 | 0.65 |
| BYD Dolphin | 0.28 | 1770 | 1570 | 2.36 | 0.66 |
| Volvo EX30 | 0.28 | 1837 | 1555 | 2.43 | 0.68 |
| Kia EV6 | 0.28 | 1880 | 1545 | 2.47 | 0.69 |
| BYD Atto 3 | 0.29 | 1875 | 1615 | 2.57 | 0.75 |
You can immediately see the dual advantage of the Model 3’s aerodynamics – low Cd and low frontal area gives it only 2/3 of the air resistance of a BYD Atto 3.
There’s a good reason why a Model 3 looks like a bar of soap, especially in white. Latest information on the new Highland version of the Model 3 claims that Cd has improved even further to 0.219 and Efficiency is 8% better.
So you should absolutely expect a small slippery EV to achieve better highway range numbers than a bigger, bluffer shaped vehicle.
If range at highway speeds matters to you search for the really excellent Cd that comes from painstaking work in the wind tunnel, and go for the smaller vehicle if there’s a choice.
If you can avoid it, don’t fit things like roof racks or aftermarket mudflaps. They will degrade your CdA. As will open windows.
Finally, here are my calculated Wh/km Efficiency numbers for a variety of EVs at that mythical steady-state cruising speed of 110 km/h on a smooth flat highway on a mild day . . .
| EV | Calculated | EV Database | Ludicrous Feed* |
| Tesla Model 3 SM SR | 160 | 149 | 156 |
| Tesla Model Y SM SR | 185 | 177 | 163 |
| MG4 51 | 180 | 186 | 200 |
| Polestar 2 SM SR | 192 | 191 | |
| BYD Dolphin LR | 180 | ||
| Volvo EX30 SM SR | 189 | 192 | |
| Kia EV6 SM SR | 195 | 197 | |
| BYD Atto 3 LR | 200 | 202 | 199 |
* Ludicrous Feed data is for highway sections only of trips
The table above is based on setting mass M for each EV according to the published Weight Unladen (EU) and Maximum Gross Weight from the EV Database. I have assumed a typical load for each EV by averaging Unladen weight and Maximum Gross Vehicle weight. A bit of guesstimation was required to fill in data gaps for the Dolphin and Polestar 2 weights.
SM = Single Motor, SR = Standard Range.
Looking at the numbers above my guess is that Tesla have done a lot of work on reducing Losses as well as improving Cd, because their reported Efficiencies are significantly better than the calculated values.
For the nerds – the maths:
Fg = g * sin(arctan(grade %)) * M M = loaded vehicle mass in kg
Fr = g * cos(arctan(grade %) * M * Crr Crr = 0.01 + v (km/h) * 5 x10⁻⁷ + v2 (km/h) * 2 x10⁻⁷
https://x-engineer.org/rolling-resistance/
Fa = 0.5 * CdA * ρ * (v + w)² v = car speed in m/s, w = headwind speed in m/s
ρ = 1.225 * exp(-0.00011856 * h) h = altitude above sea level in m
Automobile drag coefficient – Wikipedia
Kudos to the team at OmniCalculator for the Cycling Wattage Calculator (omnicalculator.com) which presents the formulas and associated technical discussion very clearly. Don’t be put off by “cycling”; the physics is just the same for cars.
“Finally you will be wondering about acceleration and braking, including regen braking. The formula is the very well known Force = Mass times Acceleration, and that is a topic for another day.”
Mark Reynolds is a retired ex-engineer and an ageing cyclist, and is equally interested in eBikes and EVs. He is in the market for a small hatchback EV. It will mainly do short trips around town, so a basic MG4 51 may fit the bill.